Software
A powerful algorithm engine built on scientific methodology. The software layer transforms raw sensor data into meaningful metrics through 600+ tests, calculations, and normative databases.
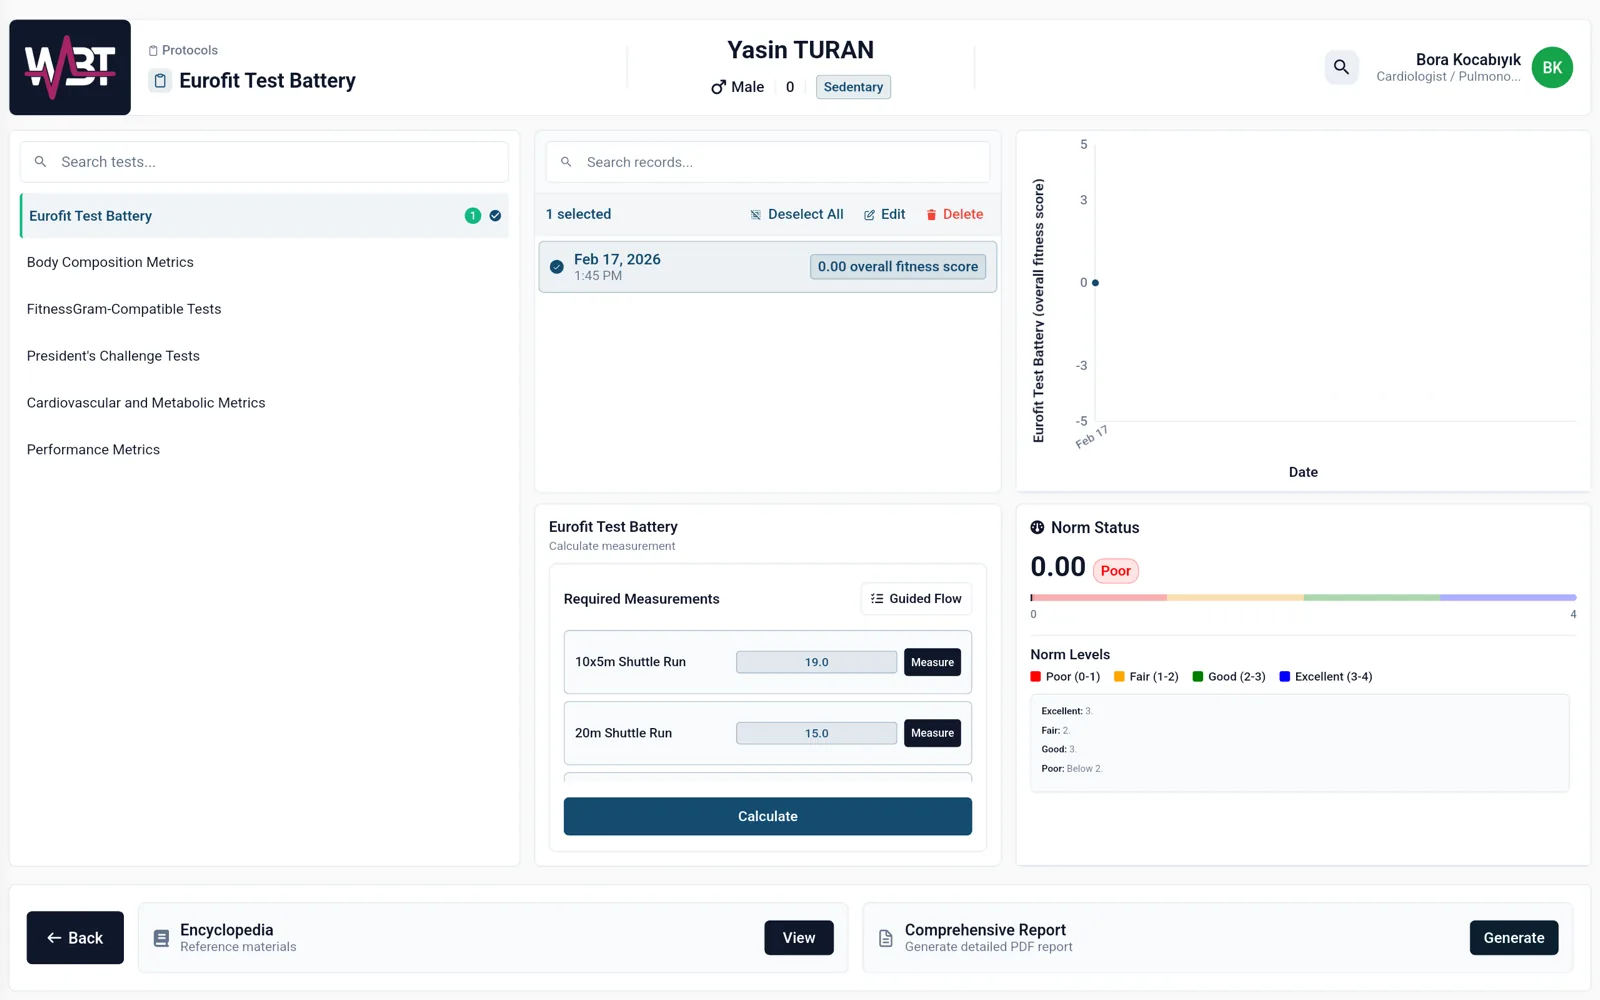
600+ scientific tests and calculation algorithms
Age, gender, and sport-specific normative databases
Automated percentile ranking and health zone mapping
Configurable test protocols and assessment batteries
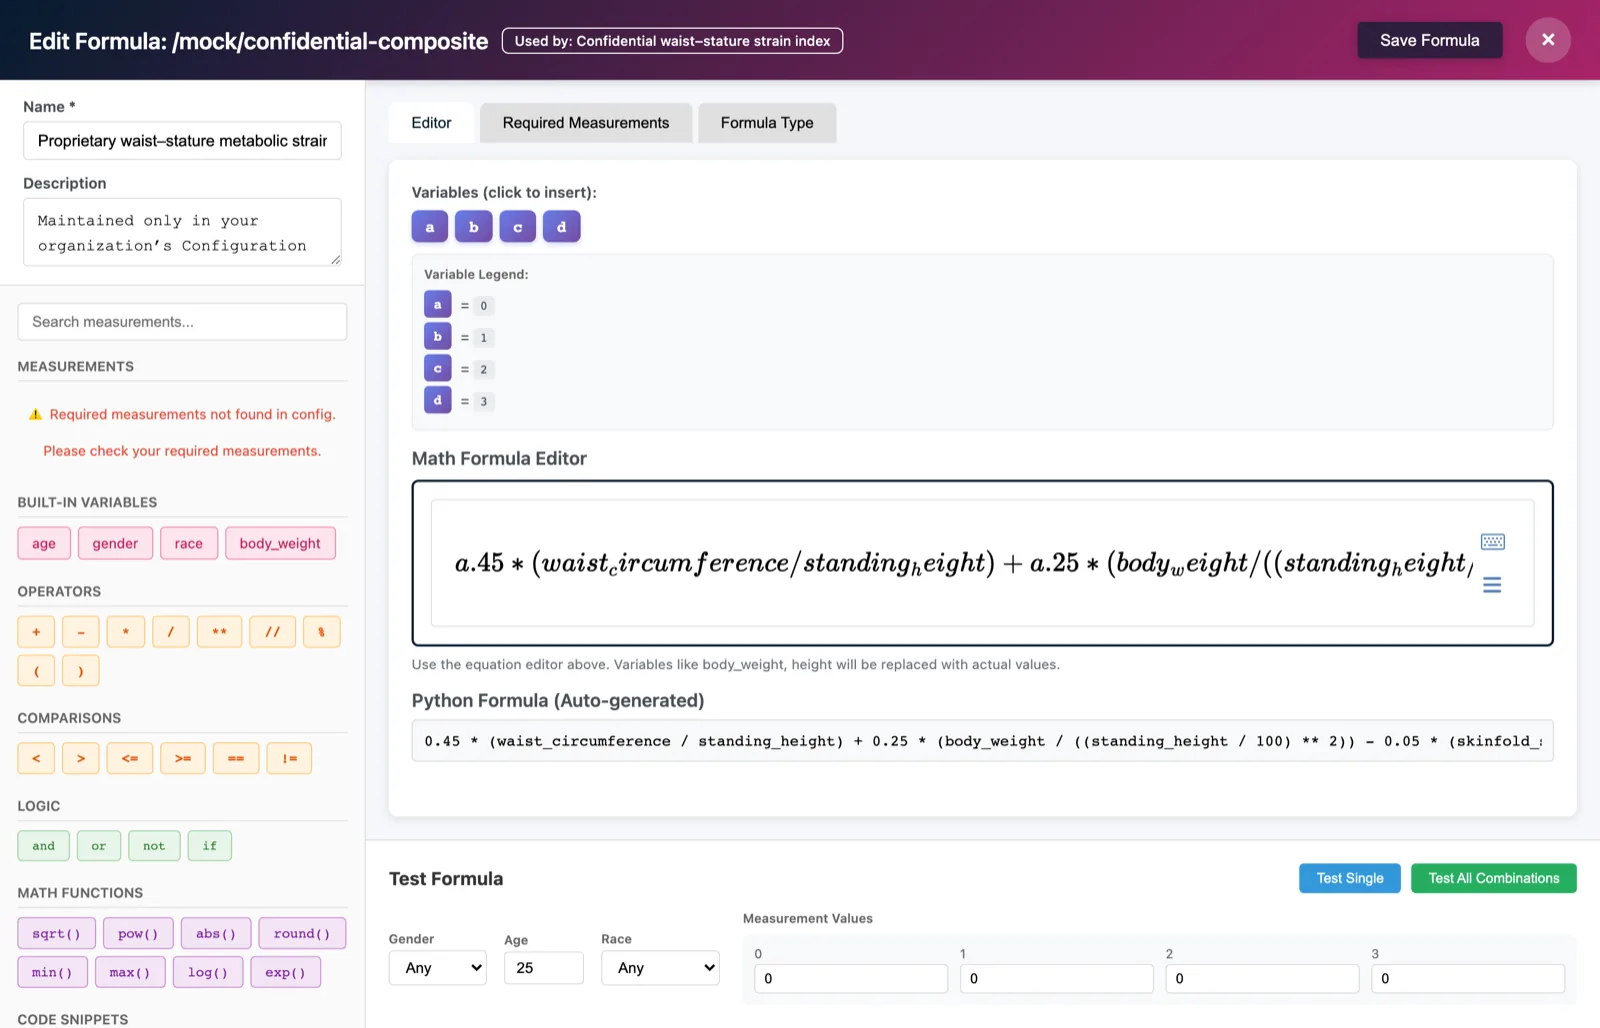
Formula editor for custom scoring models
Version-controlled test configuration management
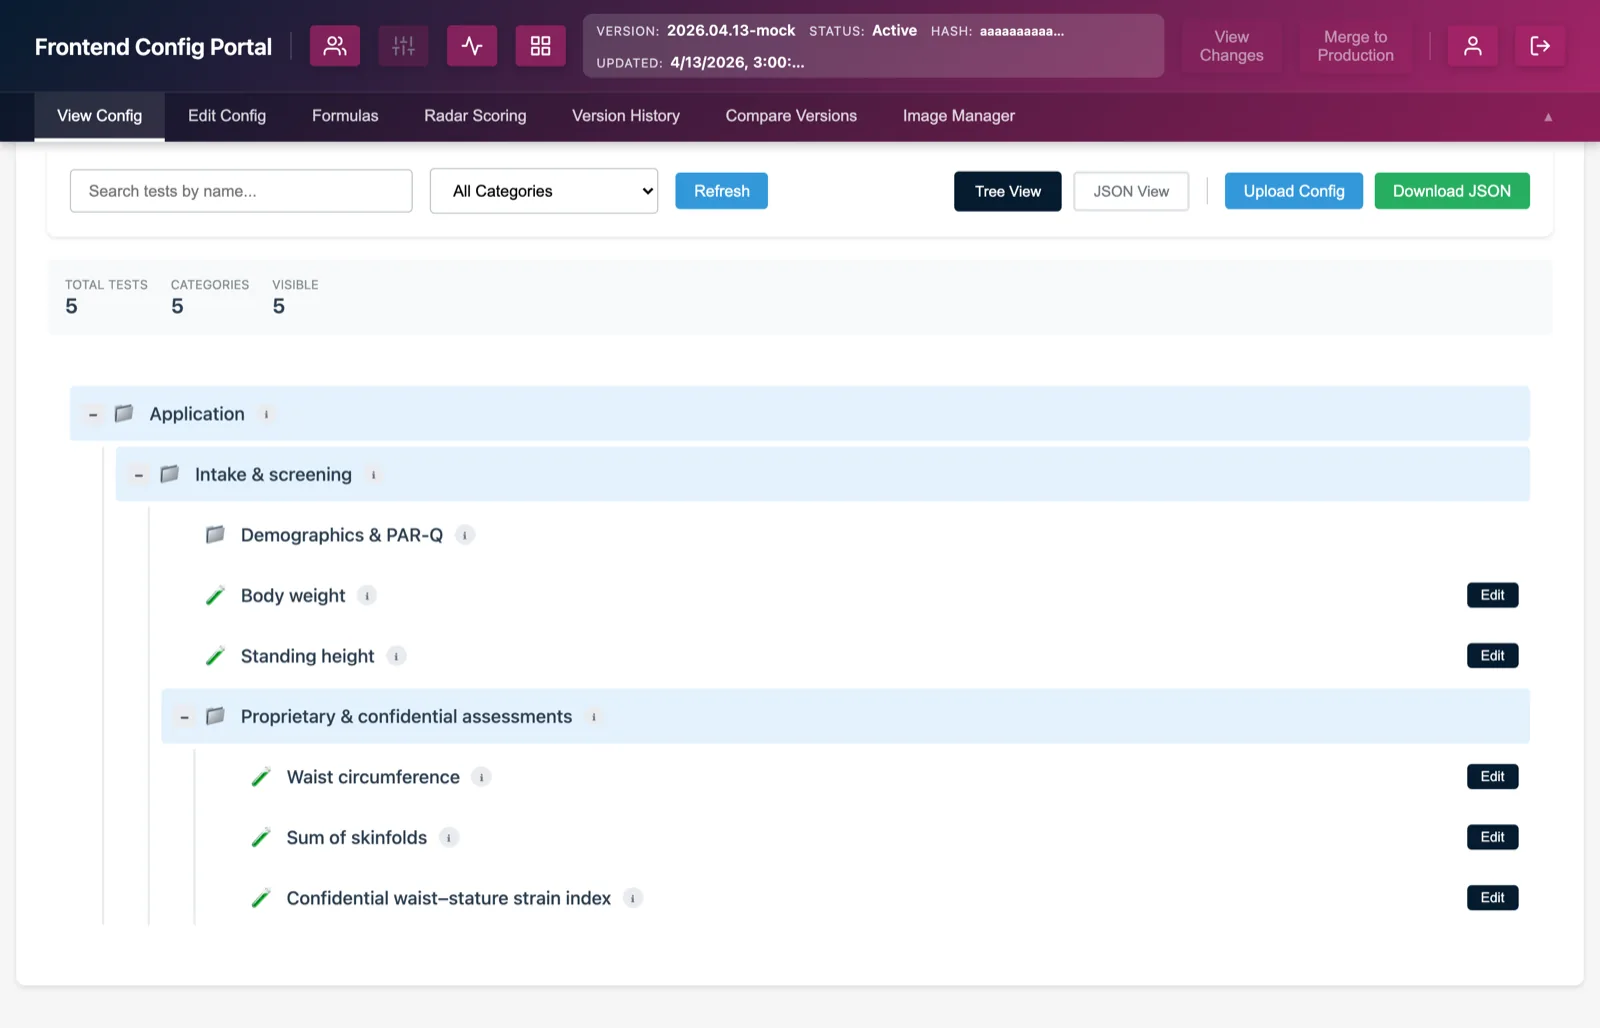
Configuration Portal (Portal Admin)
A vendor-side workspace—not the same as staff or client HTML dashboards. It defines what mobile and web experiences expose to the field.
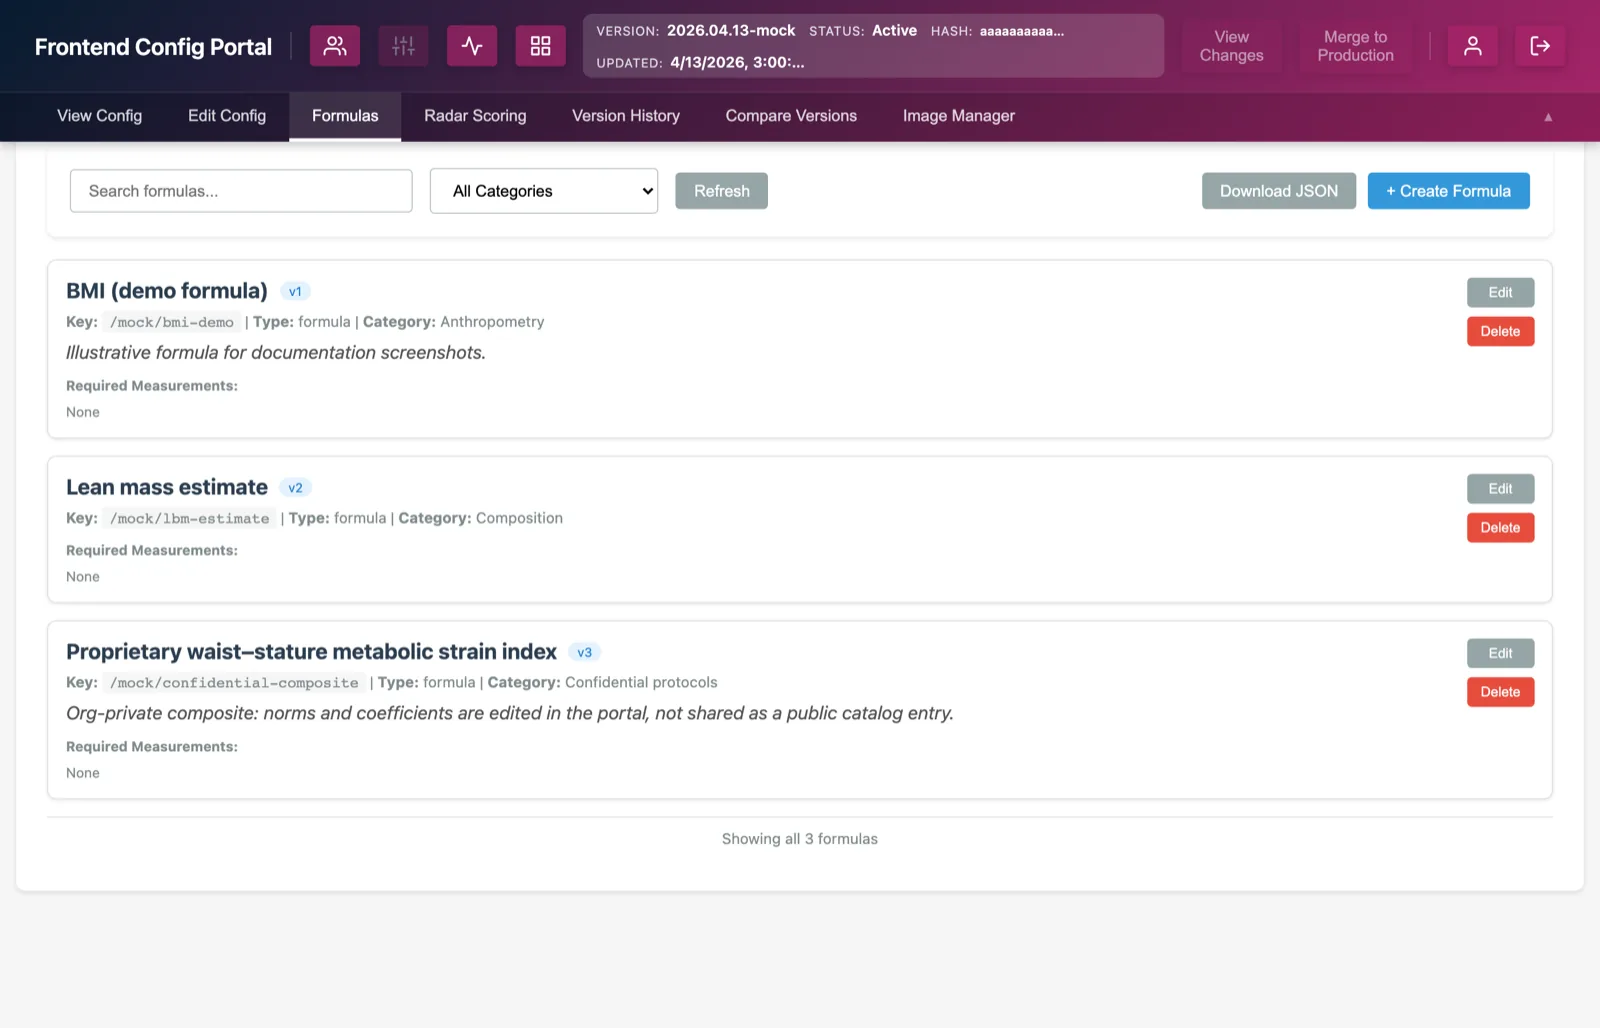
Portal Admins maintain global application configuration: hierarchical frontend configuration (tests, categories, bundles, protocols, feature routes), formulas and code-style calculations, radar and scoring definitions, versioned releases of that configuration, and config assets (images) stored alongside it. Changes flow to client applications through production and development configuration APIs and version metadata—not through the day-to-day staff panel.
| Area | What operators do | Business outcome |
|---|---|---|
| View Config | Browse the live production tree: search, filter by category, inspect routes and tests as athletes see them in apps. | A read-only map of what the product offers without risking edits. |
| Edit Config | Work in development configuration: add or reorganize categories, bundles, protocols, and tests; adjust metadata (names, copy, units). | Staged changes that can be reviewed and promoted without mutating production until merge. |
| Test editor | Full-screen editor for a single test: fields, validation, display metadata, dependencies, and links to calculations. | Precise control over one assessment atom and its ripple effects (“used by” dependents). |
| Formulas | Maintain the formula library: create and edit calculation definitions, required measurements, and formula-level versioning. | Consistent derived metrics (indexes, composites, norms) across clients and reports. |
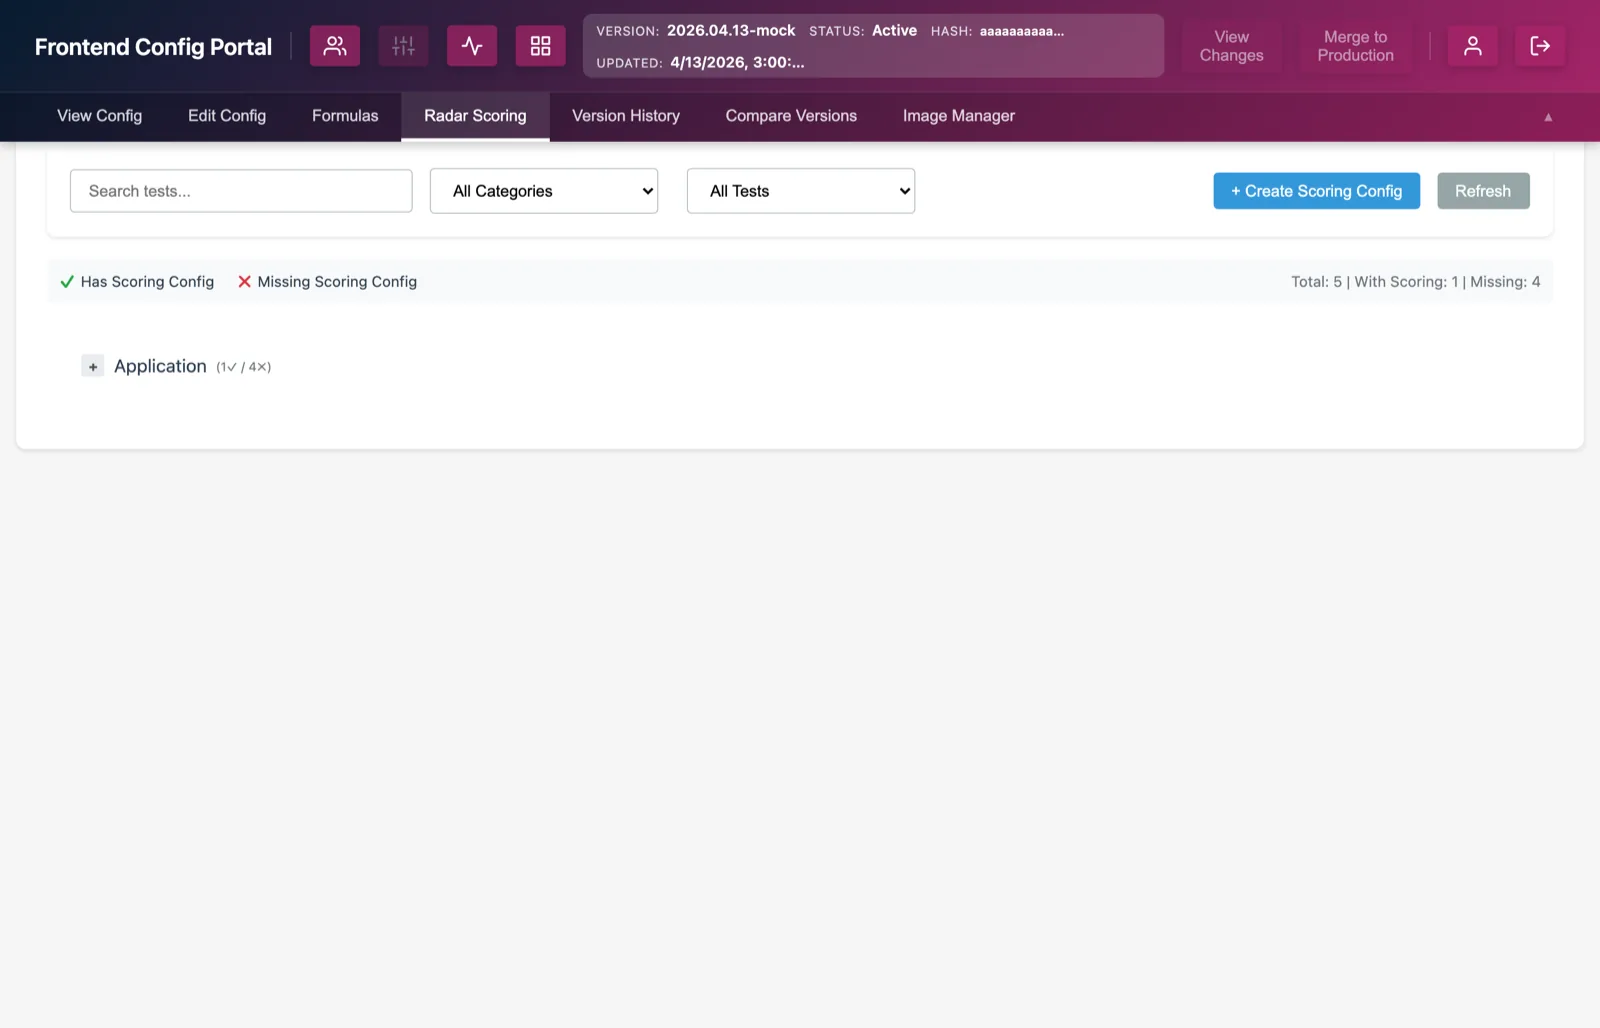
| Radar scoring | Map radar chart scoring to tests in the tree; see which routes have configs vs gaps. | Comparable radar visuals with explicit scoring rules per test. |
| Version history | Inspect published configuration versions, metadata (size, change counts, timestamps), and which build is active. | Auditability and rollback conversations with customers or compliance. |
| Compare versions | Select two versions and view a structured diff (summary counts, added/modified/removed, alternate view modes). | Release notes and impact review before or after a rollout. |
| Image Manager | List development assets (with optional unused filtering), see usage references, and align imagery with tests. | Correct instructional or UI images in the field app without orphan files. |
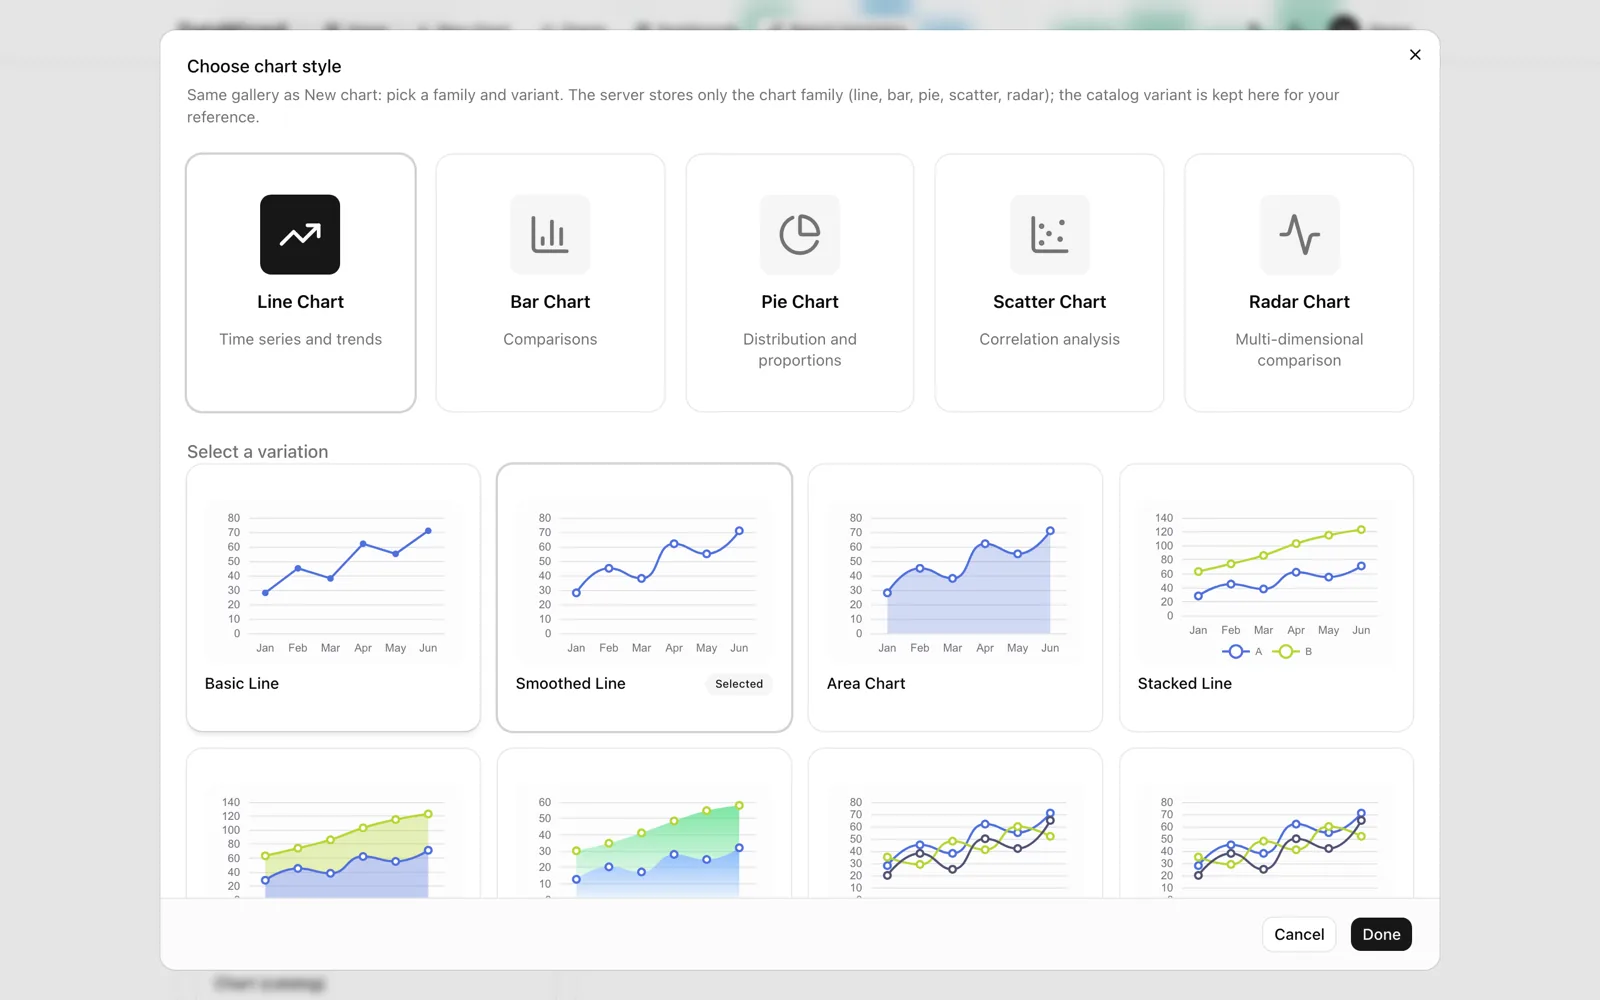
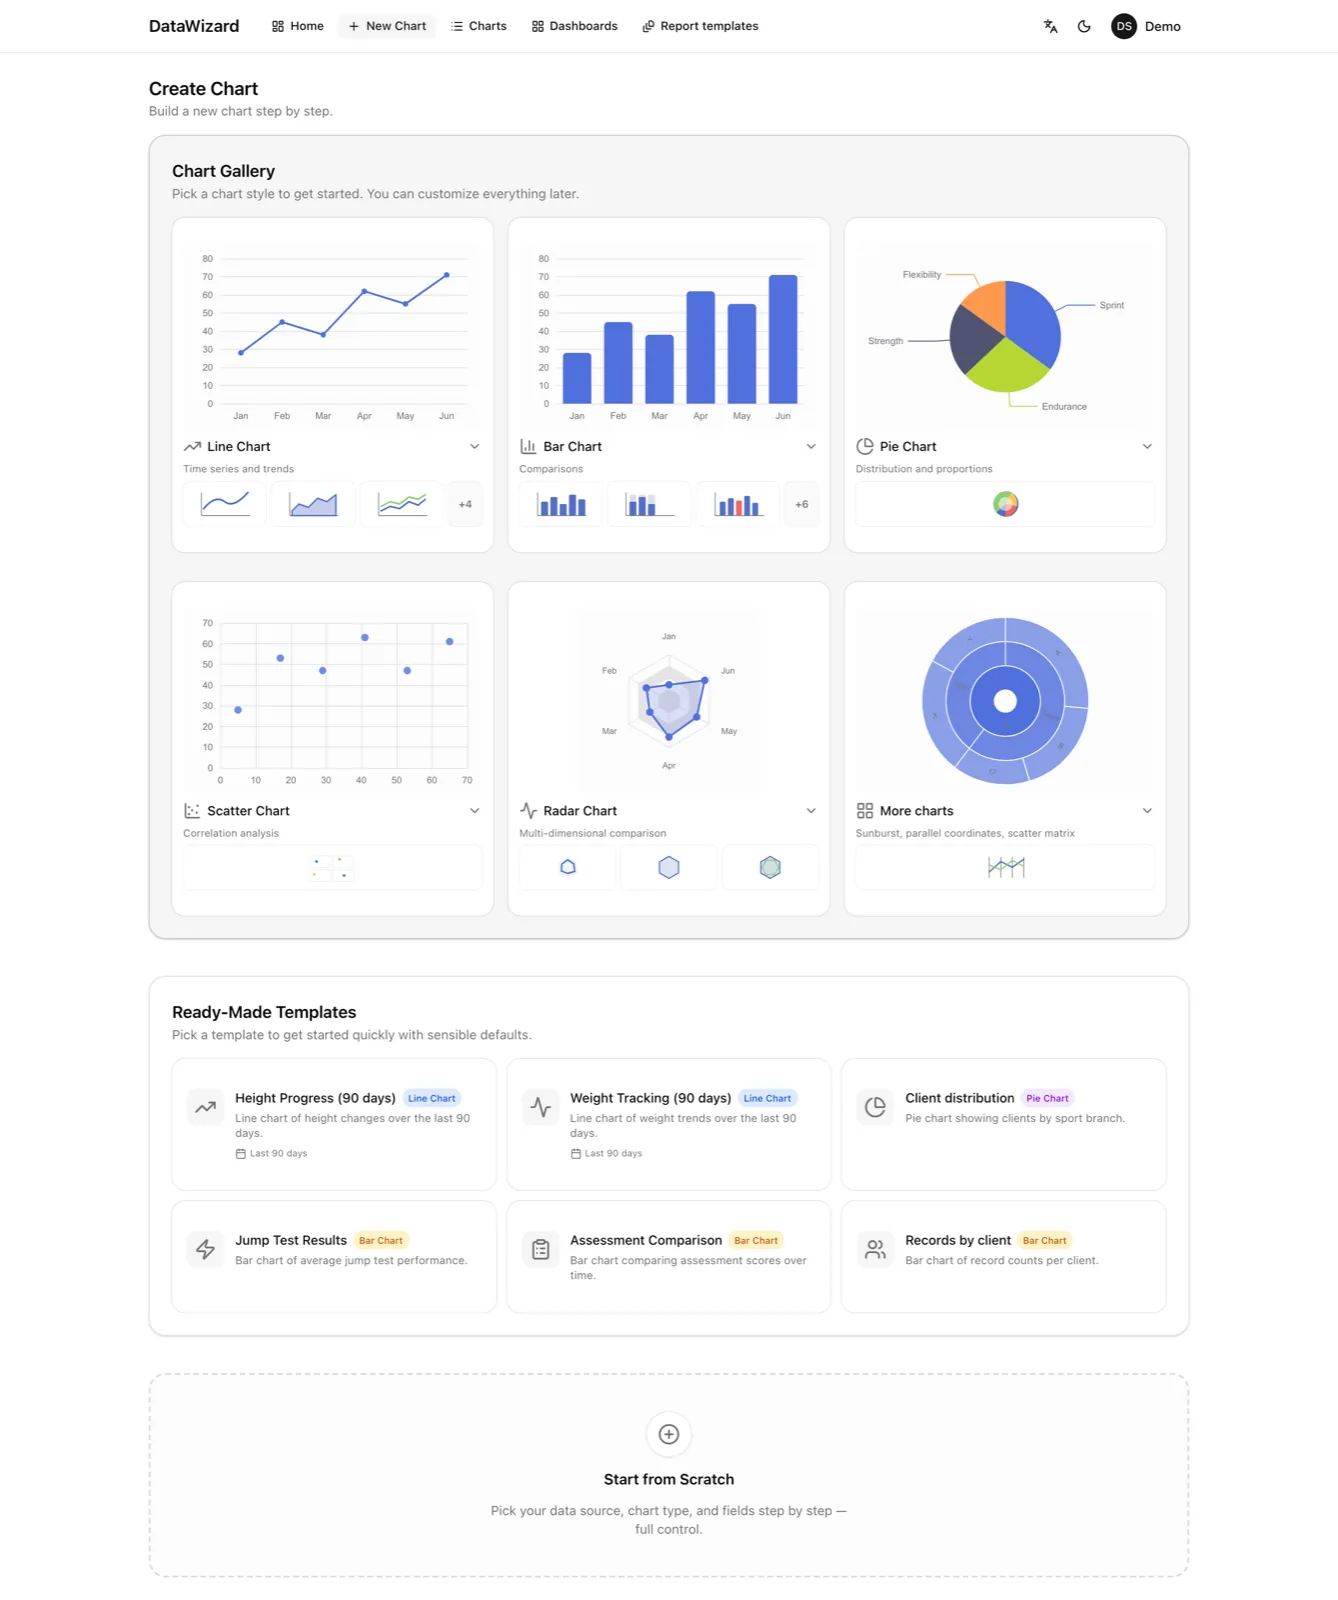
DataWizard (analytics)
Charts, dashboards, and report integration
DataWizard is a separate React application that talks to the backend over REST: chart configs, queries over datasources, and dashboard CRUD with layout and sharing.
Saved chart configurations can feed custom athlete reports when those fields are used—alongside existing report visuals.